
Results
Number of simulations with different element types and mesh size have been performed for the Cook’s membrane model.
Conclusions
A few conclusions can be derived from the presented study:
The open-source software allows to obtain a correct solution for the presented scenario. However, it should be noted that not all of the tested FE codes allow to apply the surface traction in an easy manner. For example, the Calculix solver does not have a possibility to apply surface traction condition. In this study, a free pre- and postprocessing tool called (PrePoMax)[http://lace.fs.uni-mb.si/wordpress/borovinsek/] was used to create a surface traction definition. This software converts the loading into a set of concentrated loads applied at nodes. In contrary to Calculix, the Code_Aster and Elmer package allows to apply a force distributed over area in directions of global coordinate system.
It can be noticed that the linear tetrahedral elements show better convergence rate with reference to linear hexahedral mesh. It was assumed during the study that the edges were discritised uniformly (for example, each of the edges was split into equal divisions). As a result of that, a moderate value of aspect ratio for hexahedral mesh may have influenced the solution for these elements.
The linear elements show poor convergence rate for near-incompressible scenario. While it is not a surprise that the quadratic shape function allows to obtain more accurate solution, the graphs prove really well that the linear shape function will not allow to obtain a target value.
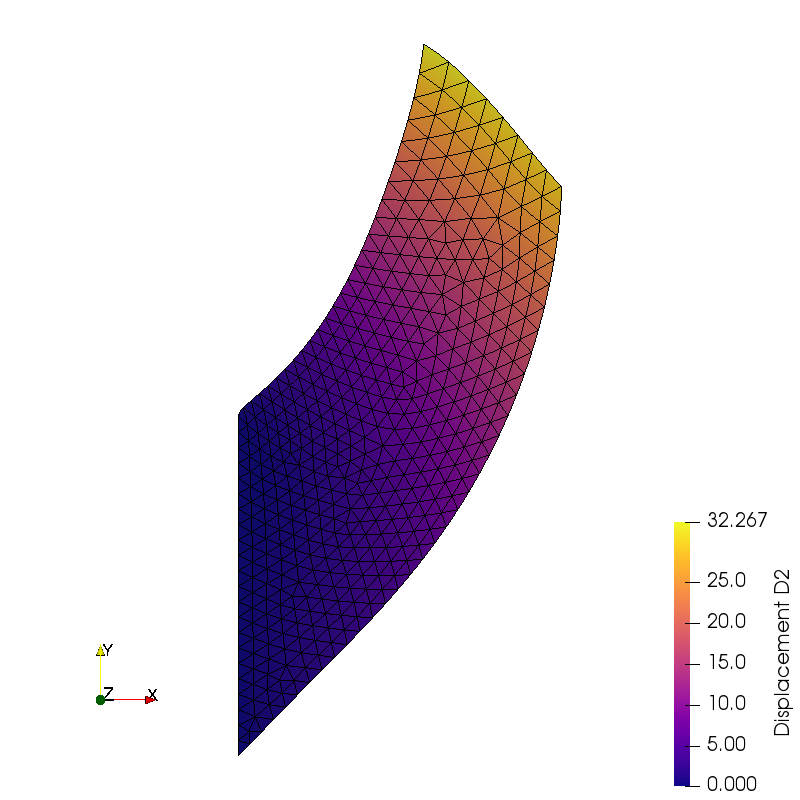
Fig. 11 Cook’s membrane benchmark results
Poisson’s ratio v=0.33
Linear and Quadratic Tetrahedral mesh
Solver |
Coarse Mesh |
Fine Mesh |
Very Fine Mesh |
|---|---|---|---|
Calculix |
24.36 / 31.70 |
29.78 / 32.05 |
32.27 |
Code_Aster |
24.32 / 31.63 |
29.71 / 31.99 |
32.20 |
Elmer |
24.16 / 31.59 |
29.76 / 32.02 |
32.28 |
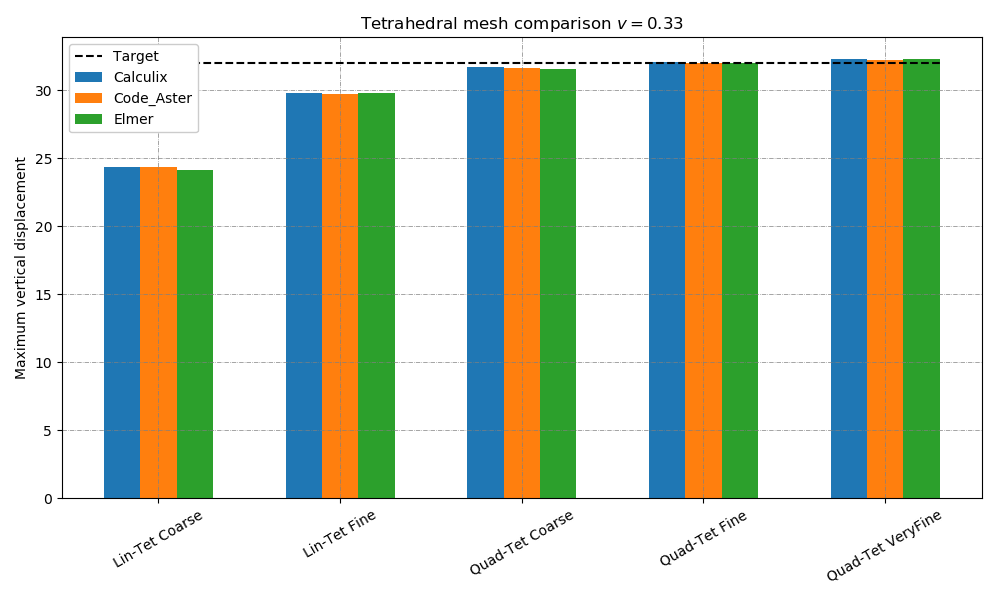
Fig. 12 Graph representing the displacement [mm] results from the simulations with linear and quadratic tetrahedral elements
Linear and Quadratic Hexahedral mesh
Solver |
Coarse Mesh |
Fine Mesh |
Very Fine Mesh |
|---|---|---|---|
Calculix |
23.30 / 31.34 |
28.78 / 31.92 |
32.27 |
Code_Aster |
23.21 / 31.26 |
28.70 / 31.85 |
32.20 |
Elmer |
23.30 / 31.34 |
28.78 / 31.92 |
32.27 |
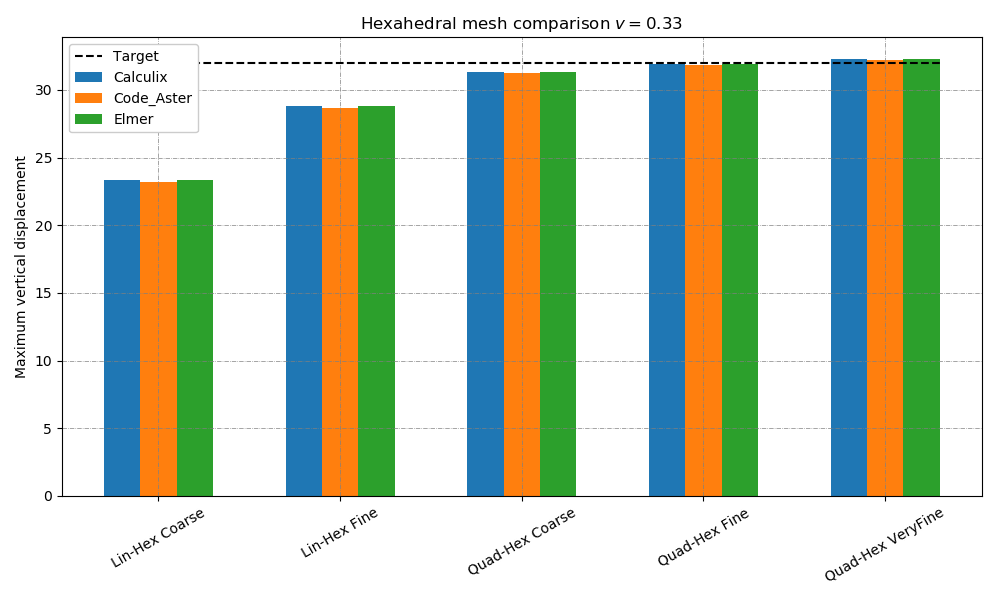
Fig. 13 Graph representing the displacement [mm] results from the simulations with linear and quadratic hexahedral elements
Poisson’s ratio v=0.49
Linear and Quadratic Tetrahedral mesh
Solver |
Coarse Mesh |
Fine Mesh |
Very Fine Mesh |
|---|---|---|---|
Calculix |
8.69 / 25.52 |
11.80 / 27.13 |
27.52 |
Code_Aster |
8.69 / 25.52 |
11.80 / 27.13 |
27.52 |
Elmer |
8.73 / 25.38 |
11.79 / 27.16 |
27.56 |
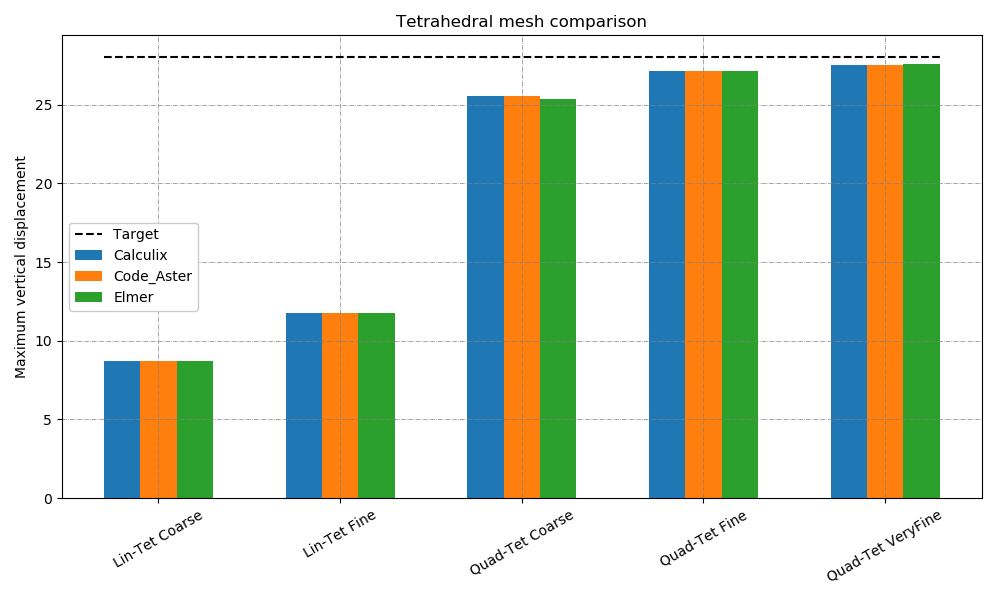
Fig. 14 Graph representing the displacement [mm] results from the simulations with linear and quadratic tetrahedral elements
Linear and Quadratic Hexahedral mesh
Solver |
Coarse Mesh linear / quadratic |
Fine Mesh linear / quadratic |
Very Fine Mesh quadratic |
|---|---|---|---|
Calculix |
7.44 / 23.60 |
7.64 / 26.03 |
27.35 |
Code_Aster |
7.44 / 23.60 |
7.63 / 26.03 |
27.35 |
Elmer |
7.44 / 23.60 |
7.64 / 26.03 |
27.35 |
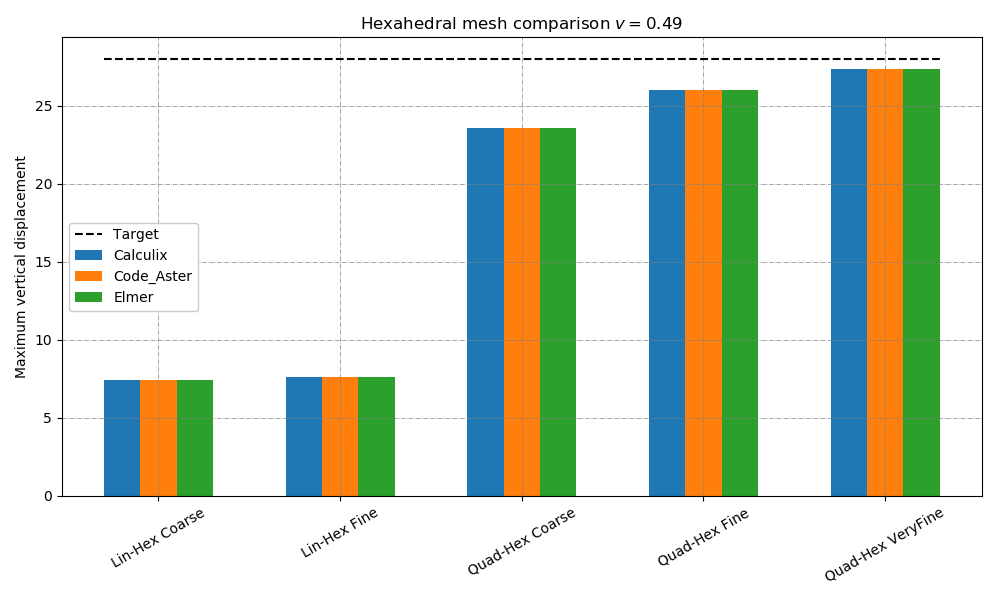
Fig. 15 Graph representing the displacement [mm] results from the simulations with linear and quadratic hexahedral elements